Want to Trade RED High-Impact Economic Data points?
New Economic Calendar Package Gives Away 3 Institutional Secrets to Trade Risk Events
This will leave ForexFactory Users at a Huge Disadvantage
I'd like to give you this for FREE, but we pay thousands of dollars each month for developer costs and real time data feeds, so I'm asking for $29 per month to help offset some of our costs.
The 3 Money Making "Secrets"
That Professional Traders Use Every Day To Trade Risk Events
Powerful Institutional "High-Low" Forecasts vs Unhelpful Retail Forecasts
Everytime there is a major economic data release a number of credible institutions are surveyed to give their best estimate on what the economic data point will be.
This is called the "forecast."
Retail calendars then take the middle number of that estimation. This becomes the "forecast" number in their economic calendars.
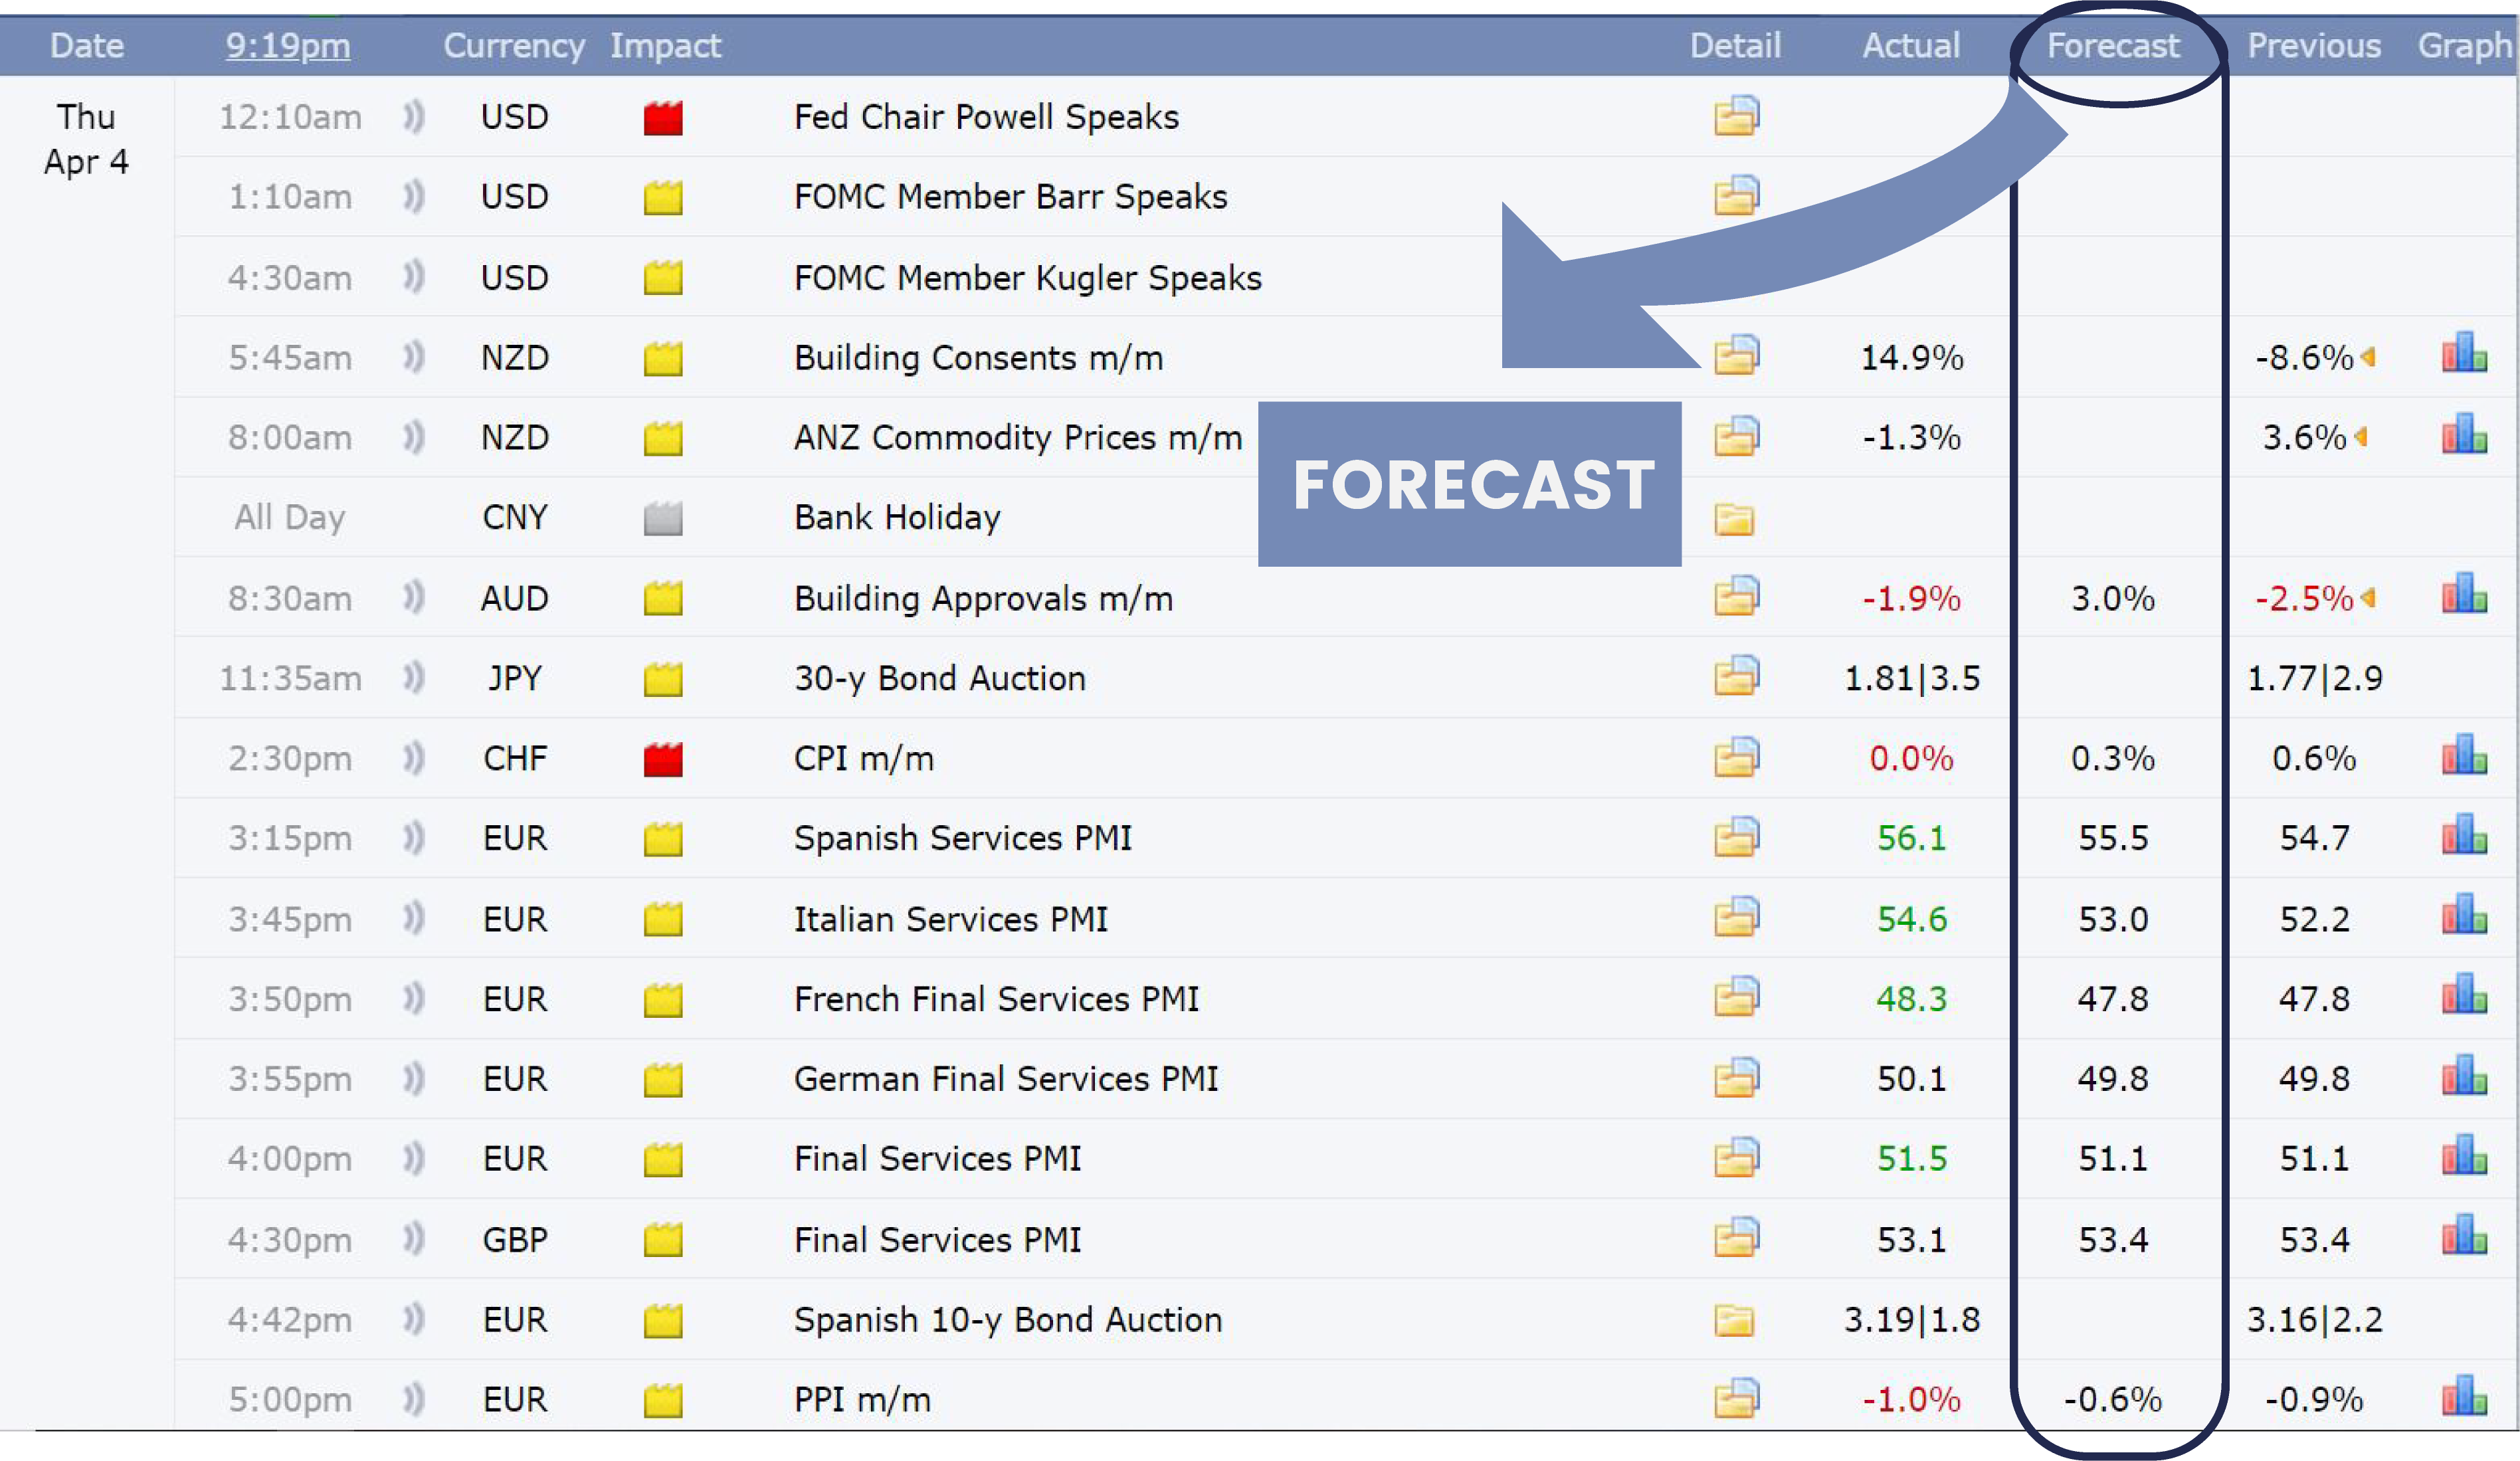
However this number is quite unhelpful. Read on and you'll see why.
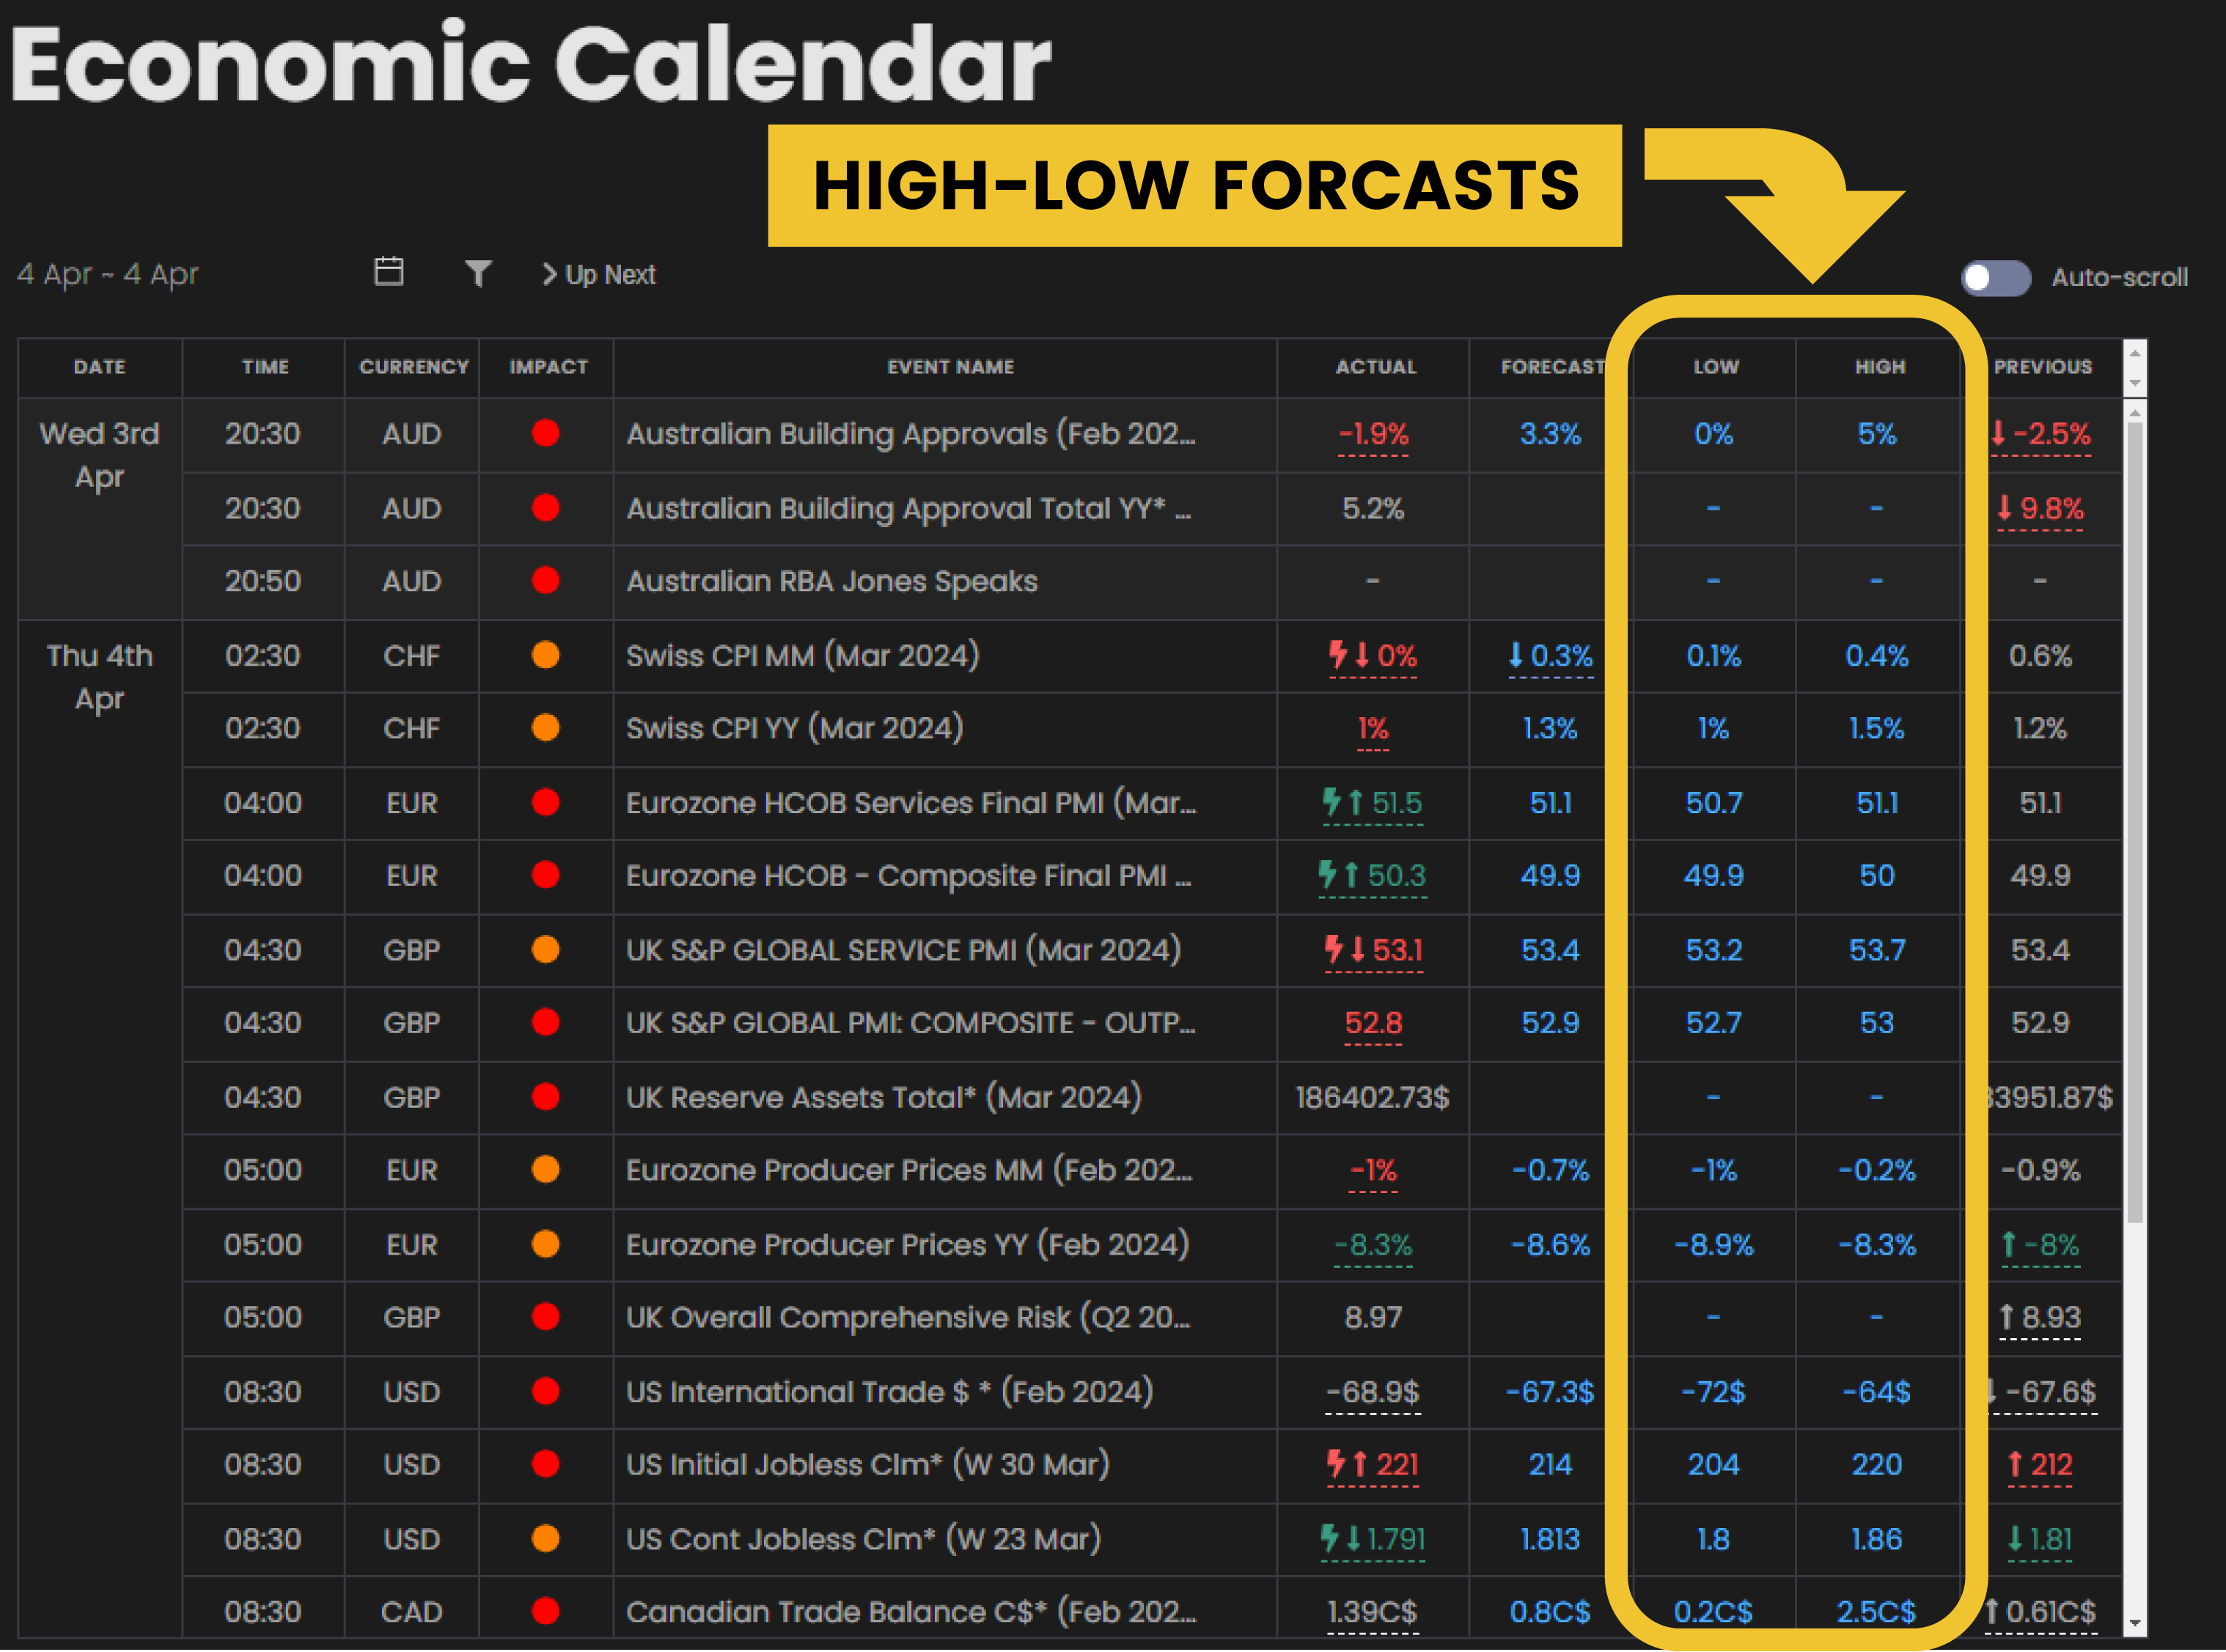
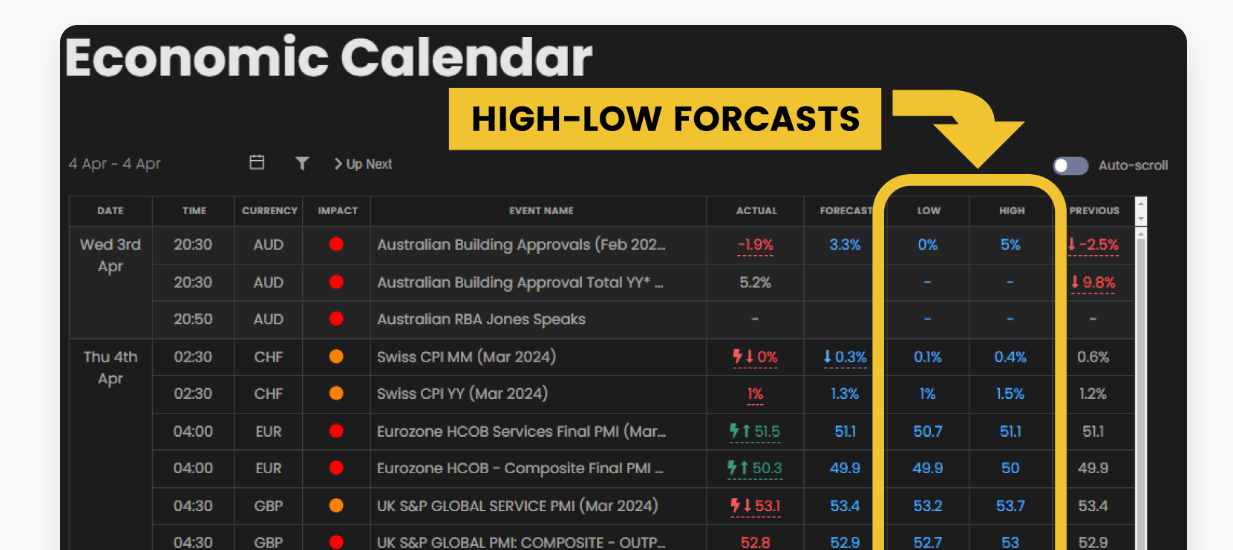
The other advantage professional traders have is the "lightning bolt feature."
This lightning bolt pops up immediately if there is a deviation above the high forecast or below the low forecast.
This gives them a huge timing advantage as they don't even need to think about the numbers but can get straight away into a trade.
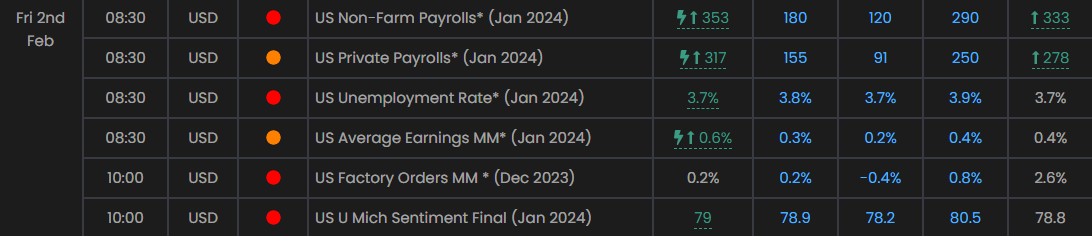
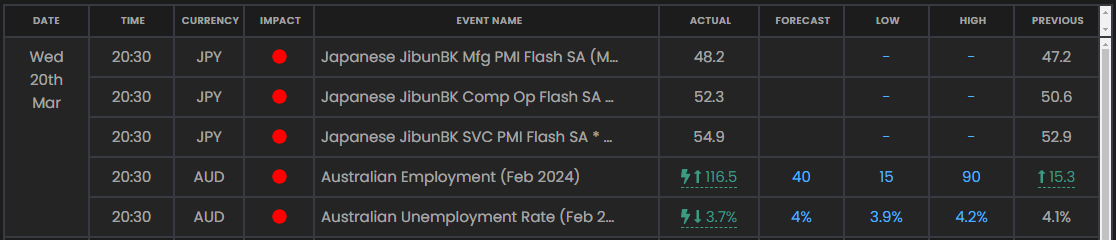
Remember if the lighting bolt appears it signals a "shock" deviation. No analysts surveyed expected this number. That is why these deviations move the market.
But the next question is – WHAT events should I trade? What events should I stay away from? Which events would be a waste of time?
Institutional Traders know WHAT economic data points are worth their time
and which ones will be a snooze fest
Over the last months there are hundreds of data points to focus on, but which ones will really move the market?
Institutional traders understand that the market is focused on the economic events that the respective Central Bank is focusing on that week.
Most times this is a select number of "red" market moving events such as employment and inflation. But if the "baseline" of the central bank is truly "data dependent" from their last meeting, even lower tier "red" economic events or even orange events can significantly move the market.
The market will also move more dramatically on economic events that contradict the central bank's baseline stance. EG – A central bank stance is that "inflation is moving in the right direction." Then a CPI print shows inflation going in the wrong direction and you have a great trade on your hands.
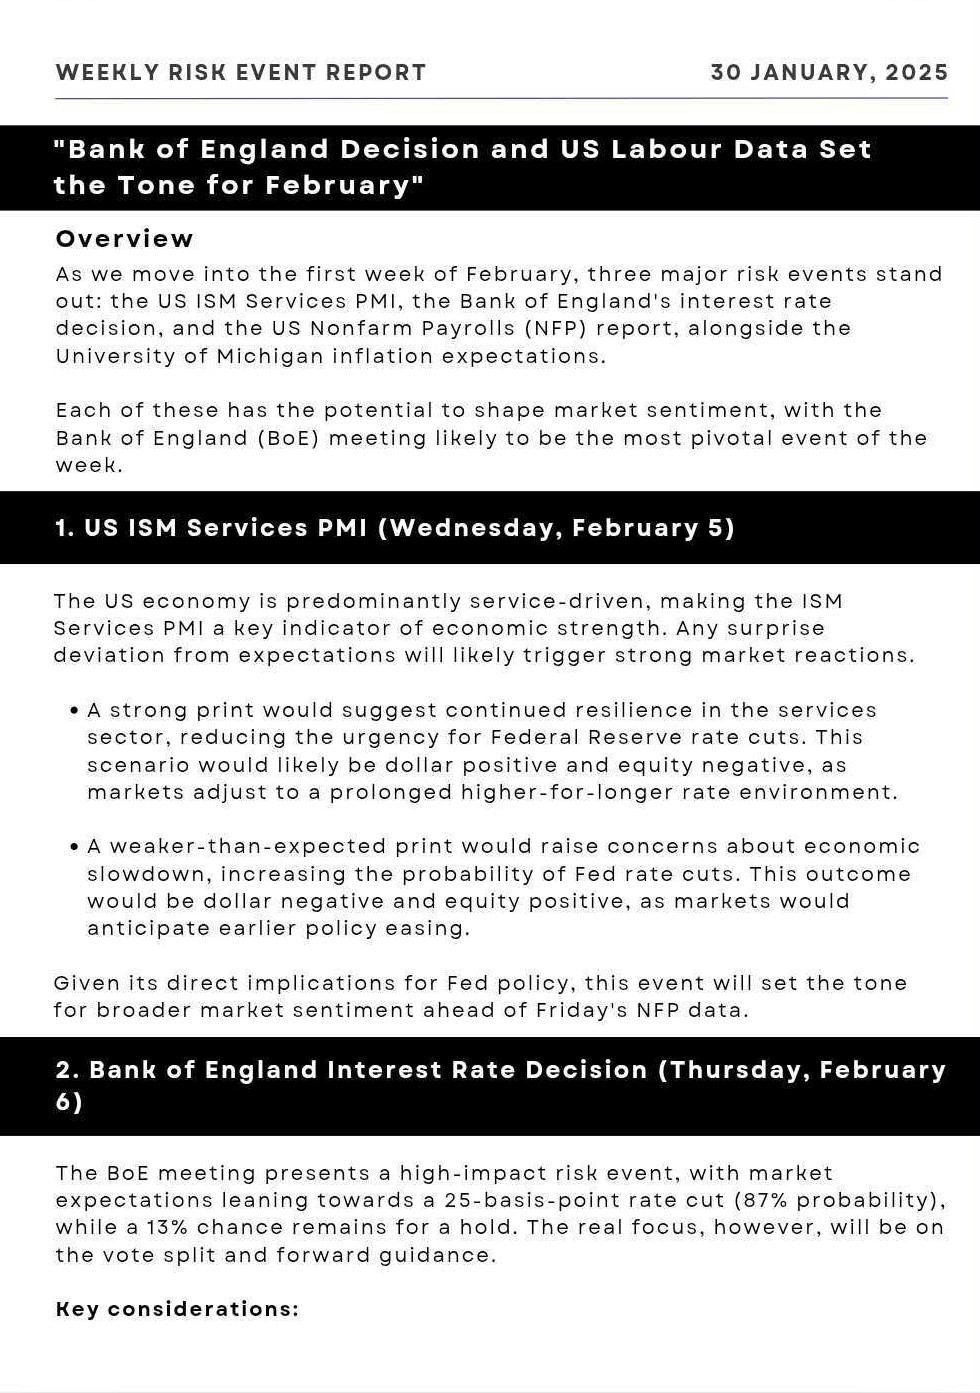
We've prepared a weekly risk event report which highlights a limited number of events each week to show up and trade.
You don't have to guess which events will be worth your time!
Institutional traders know which Forex Pairs will move the most on data releases
because they have access to professional reports
If you've been caught out trading the wrong pair…you'll know what I mean. You prepare for the event, sit down at your computer and have your charts open.
A major economic data deviation is released and you jump into your favourite currency pair. But nothing happens…the pair moves about 10 pips and then just stalls and you feel trapped thinking "should I stay in or cut the trade for a small profit or loss?"
There are two institutional reports that professional traders use to get the upper hand and know exactly which currency pair will give them the most movement.
First is the City Economic Surprise Index report
This is a study which shows you the impact of economic data points that surprise to the upside or the downside and how that relates to the currency pair. So every week this report identifies the specific currency pair that is the most sensitive to data deviations and when a pair is becoming increasingly sensitive or desensitised data releases.
Second is called the CFTC report
This report shows us the positioning of hedge funds and big players in the space and it shows you whether they are building long or short positions in an easy to understand format.
Now the magic is in using these 2 reports together to choose the correct pair to give you the most movement.
If you are approaching a major CPI release – an institutional trader will check the City Economic Surprise Index to find which pair is the most sensitive to data releases.
They will then check to see if there are stretched positions in the CFTC report.
Let's say the City Economic Surprise Index told the institutional trader that the USD/JPY was the most sensitive right now for economic data release.
He then checks the CFTC report and noticed that major players were building long positions into the USD.
Now what happens if the CPI release comes out bad for the dollar?
All those traders who wanted the USD/JPY to appreciate start getting squeezed and all the major players like hedge funds and banks going long the USD/JPY will need to liquidate some of their positions.
In this hypothetical scenario…this results in an outsized move down on the USD/JPY.
Get Everything in our Professional Economic Calendar Package
Real time Economic Calendar
High-low readings
Lightning-bolt Feature
Weekly risk event report so you know WHAT to trade
City Economic Surprise Index report and CFTC Report so you know which pairs will move the most
We pay thousands of dollars each month for developer costs and real time data feeds. We just ask for $29 per month to help offset our data costs!