Understanding Horizontal Channels

A horizontal channel, also known as a trading range, is a price pattern that occurs when an asset’s price moves within a defined range, bounded by parallel lines
A horizontal channel, also known as a trading range, is a price pattern that occurs when an asset’s price moves within a defined range, bounded by parallel lines

Flag chart patterns are a type of continuation pattern that occur within a larger trend. They are characterized by a period of consolidation or pause in price movement
The cup and handle pattern is a bullish continuation pattern that typically forms after a prolonged uptrend. It is named after its distinct shape, which resembles a cup with a handle attached to it
A falling wedge is a bullish chart pattern that forms when the price of an asset is consolidating within a narrowing range

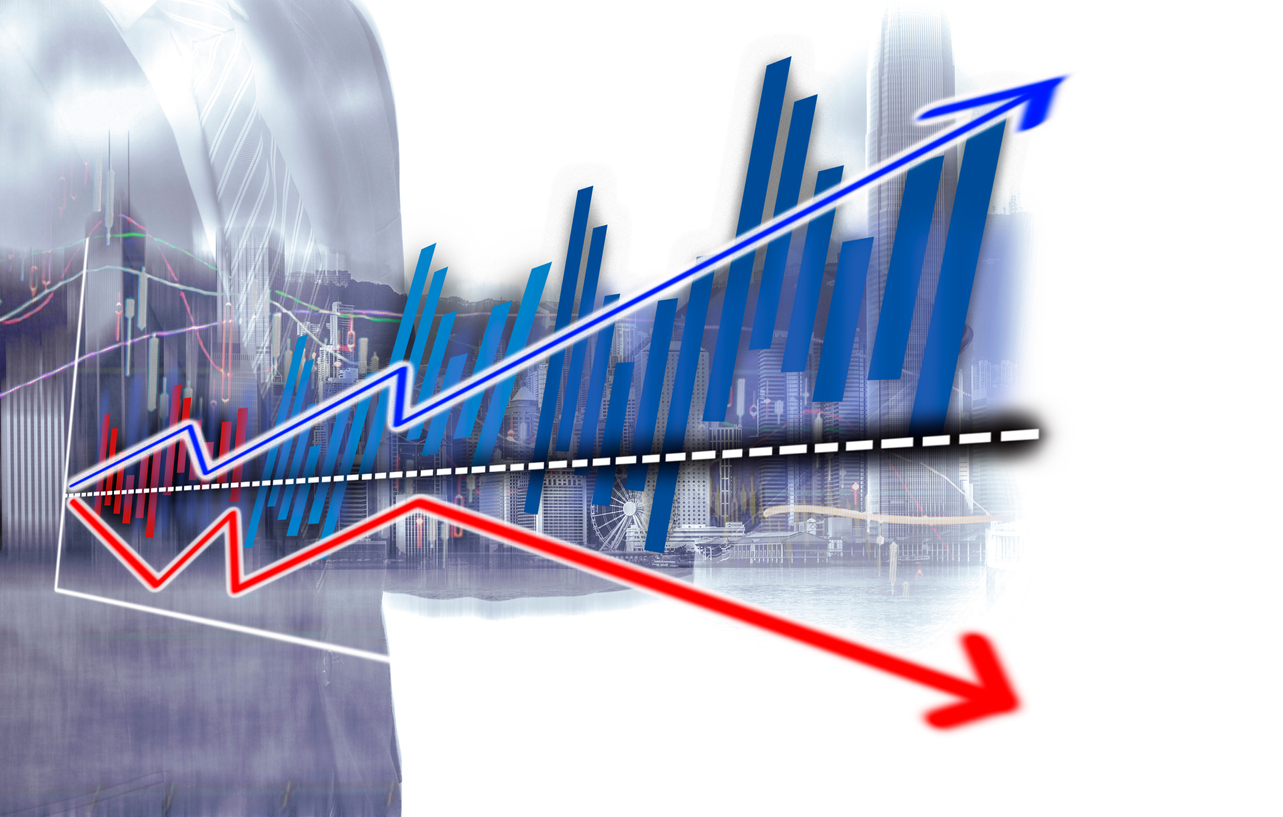
A trend channel is a graphical representation of a market trend. It consists of two parallel lines that encompass the price movement of an asset

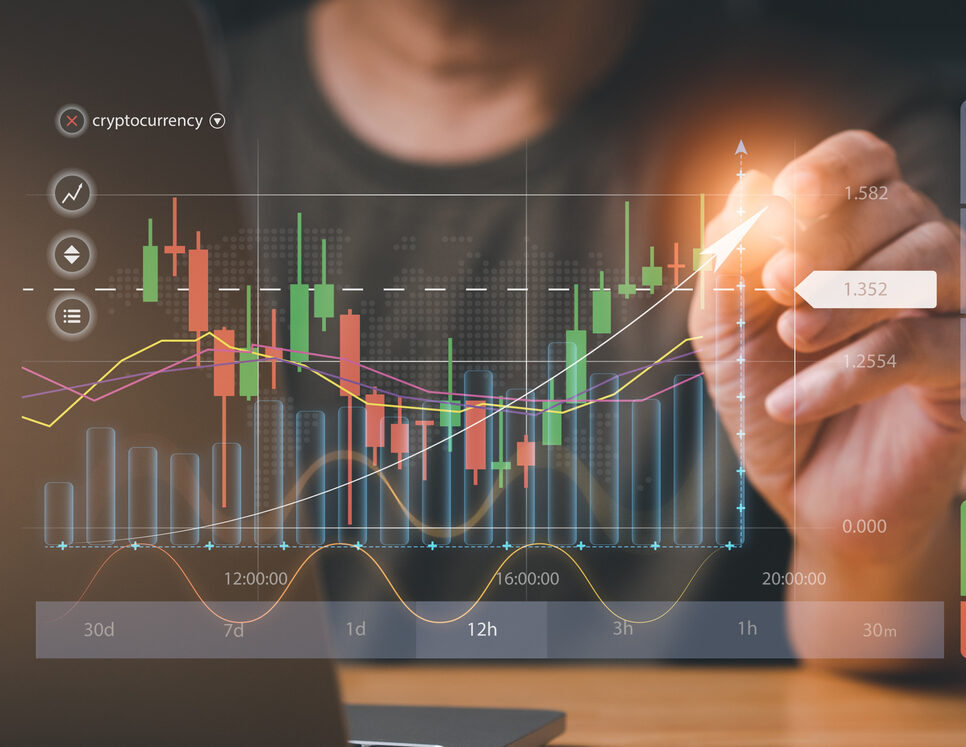
In the fast-paced world of financial trading, the ability to recognize and understand chart patterns is a skill that can set successful traders apart from the crowd. These patterns provide valuable

A descending trend line is a graphical representation of a downtrend in a financial market. It is formed by connecting a series of lower highs, which indicates a consistent decline in price over time
The wedge pattern is a technical analysis pattern that occurs when the price of an asset consolidates between two converging trend lines

An ascending channel is a bullish continuation pattern that forms when an asset’s price moves between two parallel trend lines

The bull flag pattern is a technical analysis pattern that occurs within an uptrend. It is characterized by a brief consolidation period, represented by a small rectangle-shaped flag, which forms after a strong and rapid upward move in the price of an asset