The Problem with Forex Factory & How to Actually Trade Risk Events
Table of Contents
Contrary to what the title suggest… I actually like Forex Factory. It has its uses. If you need a quick glance at what time CPI drops or when Non-Farm Payrolls hit, it does the job. For years, it has been the default bookmark for retail traders who want to know, "What’s coming out today?" And for that? It deserves credit.
But here’s the problem. Its simplicity can mislead traders. Because trading risk events is not about knowing what time something is released. We want to know - how do I trade this and how do I make money. And FF does not give you the tools to make that decision.
Most traders open Forex Factory, see three red folders, and think: "Big volatility coming." I mean they are correct most of the time…but the information is so unhelpful as to not even be relevant.
So in this article, I’m going to show you how to actually trade risk events — long form, nothing held back.
The Forex Market Is a Mean Reversion Machine
Before we even talk about which risk events to jump into and how, you need to understand the nature of the battlefield you’re stepping into. The foreign exchange market is not an equity market. It is not crypto. It is not a growth asset class. It is a relative pricing mechanism between two economies. And structurally, it behaves like a mean reversion machine.
Why Currencies Revert by Design
When you trade EUR/USD, you are not buying a company with earnings growth potential. You are trading the relative valuation between the eurozone and the United States. Currencies are anchored by interest rate differentials, inflation differentials, trade balances, capital flows, and central bank policy expectations. These forces are slow-moving and macro-driven.
So when EUR/USD spiked 20 pips because of a slightly better PMI print, nothing structurally changed about the eurozone economy relative to the U.S. economy. No earnings growth story suddenly appeared. No revolutionary technology was invented.
What you’re usually seeing is positioning. Short-term traders get caught. Algorithms react to headlines. Liquidity thins. Stops are triggered. And then? The market drifts back toward equilibrium.
Because unless something materially alters interest rate expectations or capital flows, the underlying valuation hasn’t changed. That’s the core reason forex reverts.
The Role of Dealing Desks: Getting Back to Zero
There’s another structural reason most retail traders never think about. Large banks and liquidity providers are not directional speculators. They are facilitators. Their job is to provide liquidity, match flows, manage risk, and stay as close to flat (delta-neutral) as possible.
When a wave of retail or institutional flow hits one side of the market, dealing desks temporarily absorb that imbalance. But they don’t want to carry directional exposure. They hedge. They offset. They look to mean-revert their own risk.
In simple terms: When the market overextends on one side, liquidity providers naturally work to rebalance. That rebalancing process itself contributes to mean reversion.
This is why you’ll often see sharp spikes that immediately retrace, breakouts that fail, and news candles that reverse within minutes. It’s not random. It’s inventory management and risk control at scale. Dealing desks are constantly trying to get back to zero. And that creates a gravitational pull toward equilibrium.
Why Retail Traders Get Trapped
Retail traders are often momentum-biased. The trend is your friend right? They see a breakout, a strong candle, a red folder event — and they assume continuation.
But in a structurally mean-reverting market, continuation is the exception — not the rule. Unless something shifts interest rate expectations, central bank guidance, growth trajectory, or inflation path — the market has no fundamental reason to sustain the move. So the spike becomes fuel for the reversal. And retail traders become liquidity.
So What Does This Mean for Risk Event Trading?
If the forex market is structurally wired for mean reversion — if dealing desks are constantly neutralizing exposure, if valuation is anchored to slow-moving macro forces, if most spikes are just temporary order imbalances — then we have to rethink how we approach economic releases.
Because now the question becomes: What kind of catalyst is powerful enough to break the mean reversion machine? That’s the only type of event worth aggressively trading.
We are not trading risk events simply because they are scheduled. We are not trading them because they are labeled "high impact." We are not trading them because volatility expands for 90 seconds.
We are looking for a catalyst strong enough to reprice interest rate expectations, move bond yields meaningfully, force positioning adjustments, and shift macro narrative. That is what breaks equilibrium. That is what interrupts the natural pull back toward zero.
Most economic releases do not meet that threshold. But when one does — when it genuinely surprises and forces repricing — that’s when the forex market temporarily stops behaving like a mean reversion machine and starts behaving like a momentum instrument.
OK So - What Events Matter Then?
The only economic events you should care about are the ones the central bank cares about. That’s it. Retail traders get distracted by every "high impact" release on a calendar. Three red folders in a row and suddenly it feels like the market is about to explode. But central banks are not reacting to every red folder.
They are focused on 2 things: Growth and inflation. Because growth and inflation determine interest rates. And interest rates determine currency value. That’s the chain.
If a data release does not meaningfully affect the central bank’s outlook on growth, inflation, or financial conditions, it is unlikely to change the path of policy. And if it doesn’t change policy expectations, it rarely creates a sustained move in FX.
This is where most calendar-based trading goes wrong. Economic data is not equal. It’s hierarchical. Some releases directly influence monetary policy — like CPI or employment data. Some releases provide minor supporting information. And some barely register at all in actual rate decisions. But most retail calendars flatten that hierarchy.
Inflation Events (The "Rates Stay Higher or Lower?" Data)
These are the releases that directly influence whether central banks hike, pause, or cut.
Tier 1 Inflation Releases
- CPI (Consumer Price Index) — Headline and Core. This is the big one. When CPI meaningfully deviates, bond yields move immediately.
- Core PCE (U.S.) — The Fed’s preferred inflation gauge. A shock here directly influences rate expectations.
- PCE (Headline) — Broader inflation measure. Less volatile than CPI but still powerful.
- Wage Growth (Average Hourly Earnings, Employment Cost Index) — Sticky wages = sticky inflation. Central banks watch this closely.
If inflation surprises in a meaningful way, rate expectations reprice fast. That’s what moves currencies.
Growth & Employment Events (The "Is the Economy Slowing?" Data)
If inflation is one side of the mandate, growth and employment are the other. These releases matter because they signal whether the economy can handle current interest rates.
Tier 1 Growth Releases
- Non-Farm Payrolls (NFP) — The most watched labor report globally. Big deviations can reshape rate expectations.
- Unemployment Rate — Signals labor market slack or tightness.
- Employment Change (for other major economies) — UK, Canada, Australia — same logic applies.
- Retail Sales — Proxy for consumer strength. Especially important in consumption-driven economies like the U.S.
The Simple Rule
If it affects inflation → it can move rates. If it affects growth → it can move rates. If it moves rates → it can move FX. If it doesn’t connect to that chain, it’s probably not worth your focus.
Housing data. Minor sentiment surveys. Secondary regional reports. They might create a spike. But unless they alter the expected path of monetary policy, they rarely create sustained opportunity.
The Real Filter You Should Be Using
When you look at the calendar, don’t ask: "Is this red folder?" Ask: "Does this feed directly into the central bank’s inflation or growth outlook?"
If the answer is no, you are likely looking at noise inside a mean-reverting system. If the answer is yes — and the number meaningfully deviates — now you may have the type of catalyst capable of breaking equilibrium. And that’s when risk event trading becomes interesting.
Expectations: Why Deviation Is What Actually Moves the Market
Now that we’ve established which events matter — inflation and growth — and why we need something significant enough to break the mean reversion tendencies of the FX market, we need to address the most important variable of all: Expectations.
Markets do not move because data is "good" or "bad." Markets move when data is materially different from what was expected. That distinction is critical.
Before any major release — CPI, NFP, Core PCE — the market has already formed a view. Economists publish forecasts. Institutions position. Rate expectations are priced into bond markets. Currency valuations adjust in advance.
By the time the number hits the screen, a baseline already exists. If the data comes in near that baseline, even if it looks strong or weak on the surface, the reaction is often muted. The outcome was already anticipated. It doesn’t force anyone to change their outlook.
But when the data meaningfully deviates from expectations, the situation changes. Now traders have to reassess the path of interest rates, the timing of cuts or hikes, the strength or weakness of the economy, and the credibility of the central bank’s forward guidance. That reassessment is what creates sustained movement.
The Difference Between a Normal Print and a Shock
It is important to separate two ideas: a number being released and a number shocking the market. Every scheduled release produces a print. Very few produce a shock.
A shock is not simply a "beat" or a "miss" versus the median forecast. It is a deviation large enough to challenge the market’s existing assumptions.
If CPI is expected at 3.2% and comes in at 3.2%, nothing changes. If it prints at 3.3%, the reaction may be brief. If it prints well beyond the outer bounds of expectations — that’s when repricing begins. Bond yields adjust. Rate futures reprice. That is the type of catalyst capable of interrupting the mean reversion dynamics discussed earlier.
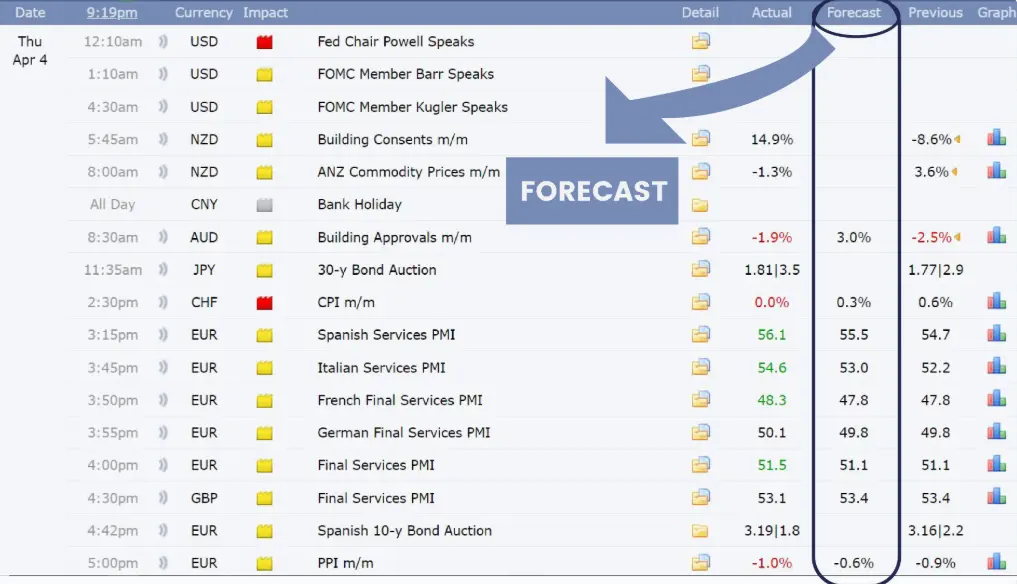
Why the Median Forecast Is Not Enough
Most calendars show only one forecast number. But a single number does not represent the full expectation landscape.
In reality, forecasts exist as a range. Different economists submit different estimates. Institutions model different outcomes. The median forecast hides that dispersion.
Understanding the range of expectations is important because it defines the boundary between "in line" and "surprise." If a release lands within that range, the outcome was already considered plausible. If it lands outside that range, the market must adjust. That adjustment — not the headline itself — is what creates opportunity.
Most moves fade unless something forces repricing. To break that equilibrium, you need more than volatility. You need information that invalidates prior assumptions.
That only happens when the deviation from expectations is large enough to change the projected path of monetary policy. So when we talk about trading risk events, we are not trading the release itself. We are trading the deviation from expectations.
How to Identify in Real Time Whether It’s Just a Normal Print… or a Genuine Shock
Once you understand that markets move on deviation — not headlines — the next question becomes practical: How do you identify, in real time, whether a release is simply "a number"… or a genuine shock that can break the mean reversion structure of FX?
This is where professional tools and preparation matter. Because by the time the number hits, you don’t have time to analyze it slowly. You need a framework that instantly tells you: Is this within expectations? Or did this just force a repricing event?
1. The Full Range of Expectations (Not Just the Median Forecast)
Most basic calendars show you one forecast number. That’s incomplete. Institutional desks don’t focus on a single median estimate. They look at the entire distribution of forecasts — the highest and lowest economist projections.
That range defines the market’s expectation boundaries. Before the release, you should know the median forecast, the highest estimate, and the lowest estimate.
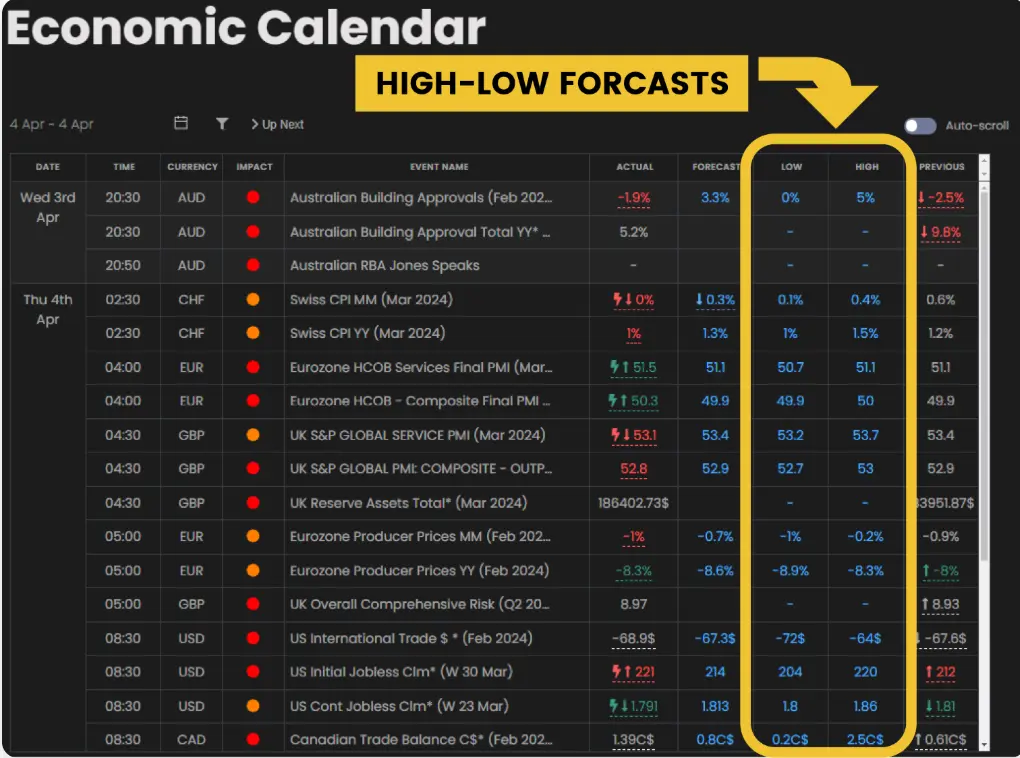
That high–low range creates what we call the shock zone. If the actual number prints inside that range, it was already considered plausible. If the number prints outside that range, it means the data exceeded the most optimistic expectation or undershot the most pessimistic expectation.
2. The Lightning Bolt: Instant Shock Confirmation
In fast markets, hesitation kills opportunity. When a major release hits, you don’t want to manually calculate whether it’s meaningful. You want immediate confirmation.
This is where professional-grade tools simplify decision-making. When a number prints outside the full forecast range, a lightning bolt appears next to the release. That visual cue confirms in real time that the data has landed outside the expected distribution.
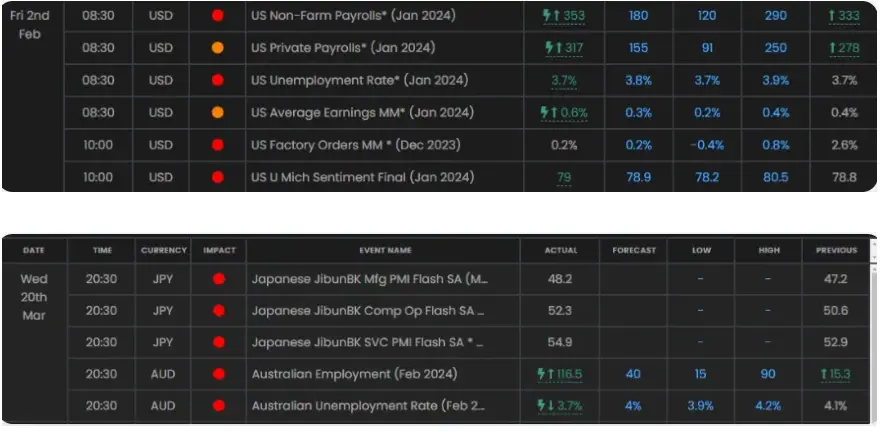
Lightning bolt = genuine deviation. No lightning bolt = likely within expectations. That single visual filter prevents overtrading marginal beats.
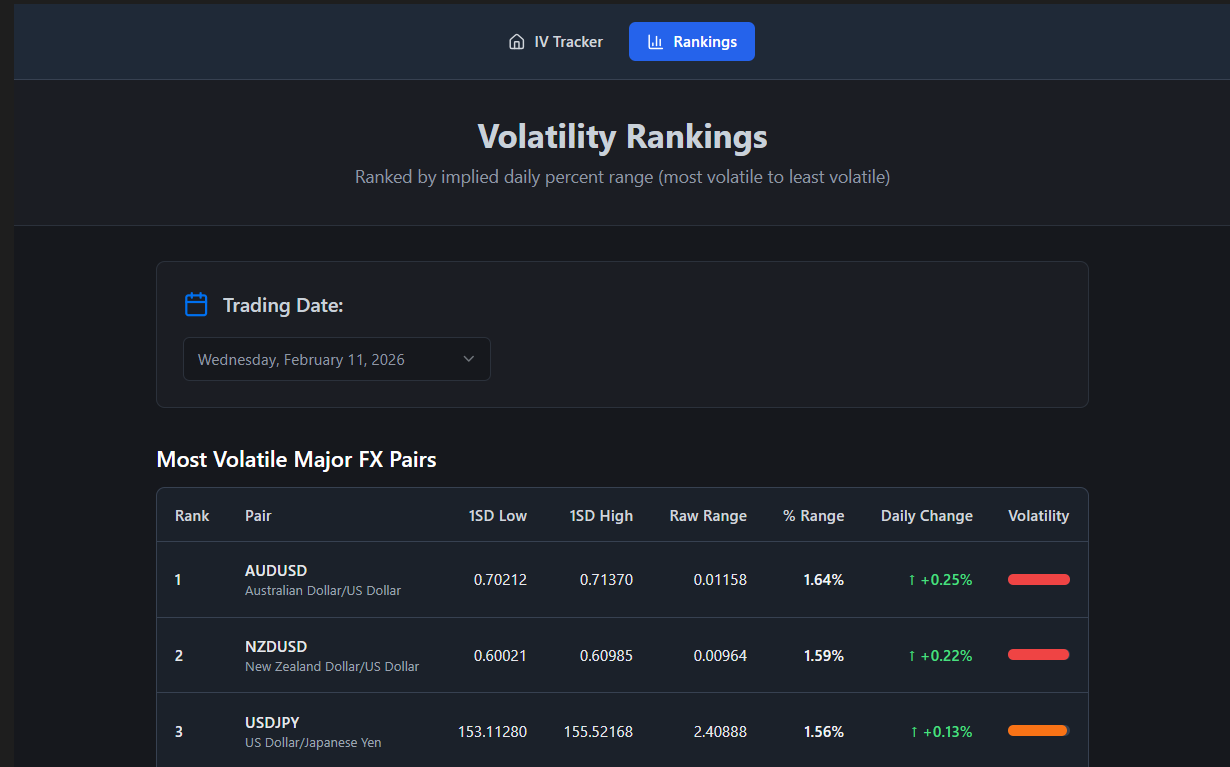
3. Implied Volatility and Choosing the Right Currency
Even when you correctly identify a shock, execution still matters. Not all currency pairs respond equally. Professional traders pay attention to implied volatility — the options market’s pricing of expected movement.
If implied volatility is elevated into a major release, the market is already bracing for movement. That can increase follow-through when a genuine shock hits.
Practical Execution: How to Enter the Trade
- Wait for the Maximum Deviation to Print: Do not react to the headline instantly. Wait for confirmation that the full data set has printed and the deviation is real.
- Choose the Right Pair: Identify strength and weakness alignment. Pair a strong currency against a weak one if the data supports the trend.
- Entry - A Combined Approach: Once the shock is confirmed, allow the first one-minute candle to print. Enter after the close in the direction of the deviation.
Developing the Swing Trade Extension
Occasionally, a deviation does more than create a short-term spike. It materially shifts expectations around monetary policy. When yields don’t just react but trend, the opportunity extends beyond an impulse trade.
- Phase 1: Take the Impulse - Capture the initial move as a scalp (30-70 pips).
- Phase 2: Wait for the Retracement - Wait for approximately a 38% retracement of the entire impulse move.
- Phase 3: Re-Enter Toward the Range High - Re-enter in the direction of the original move once the pullback stabilizes.
Check out our professional trading tools to help you with these events, including our pro calendar, implied volatility tracker and newsfeed and audio squawk.