Get Institutional Positioning Insights to Find Massive Swing Trades
Put the odds in your favor before you pull the trigger
Positioning Secrets Institutional Traders use to Find Swing Trades
The Return % Distribution Insight
If you are looking to hold a trade for days or weeks the very first thing you should check is seasonality. If I'm going to long the EUR/USD, I need to put the odds in my favor ahead of time: How many times in the past 10 years has the EUR gone in my direction for the days I'm looking to trade.
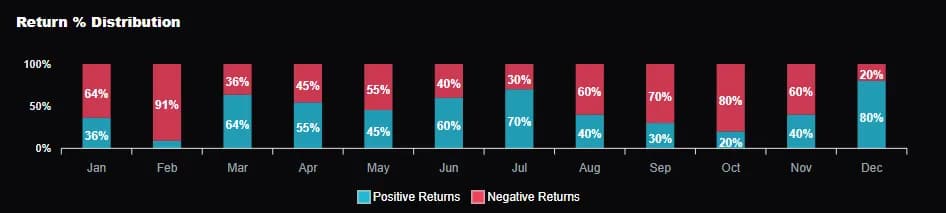
The first tool we check is called the return % distribution. This gives me a binary answer to how many times the EUR over the past ten years has ended positive or negative on the month.
Let's say we are in March. I quickly check our return % distribution indicator and what does it tell me?
64% of the time over the past ten years, the EURO ended the month positive. So right away I know I want to long the EUR for a swing trade and I need a really, really good reason to go short. I need an even better reason to go long in February – look at that 91% of the time the EUR has ended the month lower.
Monthly Performance Averages Tell Me How Much To Risk
The next thing I want to check is: what is my potential return?
If I only stand to make 1% this is going to influence how much I risk. Obviously, we don't want a negative risk to reward ratio.
So I look at the monthly performance average returns. The graph looks like this:
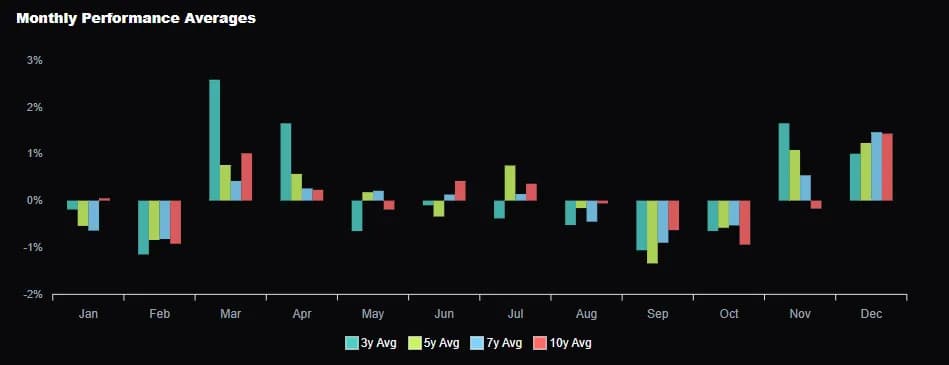
If I hover over the chart in march, the 3 year average returns 2.58%, the 5 year is .76%, the 7 year .42% and the 10 year is 1.01%. If I take the average of these returns I get: 1.19%.
So my goal then is to make 1.19% on this swing trade. This means I want my risk to be at least half of this so I get a good RR ratio.
Ok what do we have so far? We have a pair to trade that goes our direction 64% of the time in March.
We have an expected target of 1.2% so we know to put our risk at about 70 pips or so.
But we need more edge, so we want to look at what major participants are doing.
How we Follow the Hedge Funds
The Commitments of Traders report helps us follow the positioning of major hedge funds. Now COT data is released every Friday at 3:30 PM ET, showing positions as of the prior Tuesday. It covers all U.S. futures markets and can give us some valuable insights.
Who are the players?
The COT report (Commitments of Traders) includes two primary types of market participants. The first are Commercials, also known as hedgers. These are typically large corporations, banks, and importers/exporters who use the futures market not to speculate, but to hedge real-world business exposure.
Their activity often reflects fundamental value in the market, and they tend to behave in a countertrend manner—buying when prices are low and selling when prices are high. Because of their deeper ties to the underlying asset, they're often viewed as the "smart money."
The second major group is Leveraged Funds, which include hedge funds, CTAs (Commodity Trading Advisors), and macro funds. These traders are in the market to make money from price movements and are typically trend-followers with high turnover. They are more likely to take speculative positions, riding market momentum rather than fading it like Commercials often do. Their activity can provide insight into short-term sentiment and speculative positioning.
We want to follow the hedge funds while open interest is not at extreme levels.
If we look at the chart below – we see something very interesting on March 3rd.
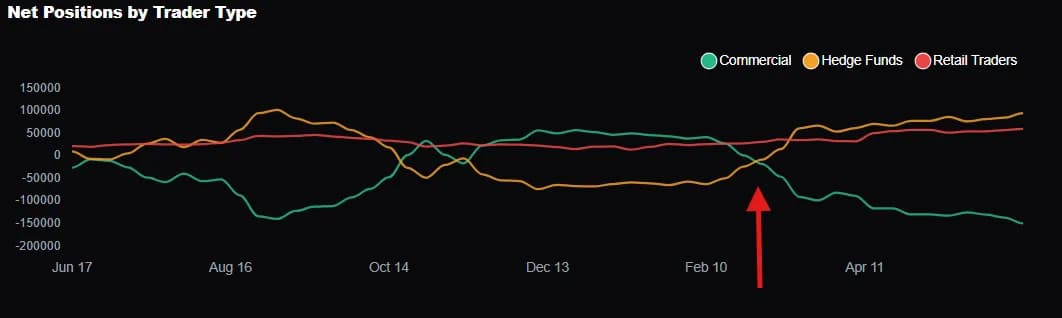
You see the green line are the commercials – they are interested in hedging their position as the euro moves higher.
The gold line represented above are hedge funds. They were looking to go long the Euro for momentum trades and to capture upside as speculators.
What's happening to this line? It just crossed over and is starting to diverge. Commercials are hedging their risk as the EUR moves higher and hedge funds are starting to get excited about the prospect of making money on the EUR as it moves up.
How to not be late to the party
But we also need one other detail – we don't want open interest to be at extreme levels. Because then that could be a sign for a reversal as the market is getting overheaded.
Instead we want open interest to be at a moderate level with room to increase in the trade.
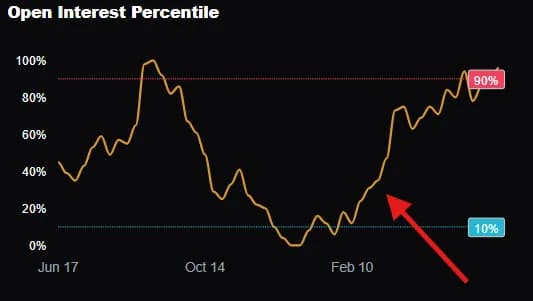
What do we see? Open interest is sitting at 35%. Plenty of room to run and not at historical highs like it is right now.
Now let's add up all the odds we just put in our favor.
- #1we were able to quickly identify a pair to swing trade that wins most of the time in March. The EUR moving up
- #2We were able to identify how much we should risk and how much we should target before trailing the trade.
- #3We were able to see that major hedge funds and leverage funds agreed with us.
- #4We were also able to see that we were not late to the trade with open interest being at moderate levels.
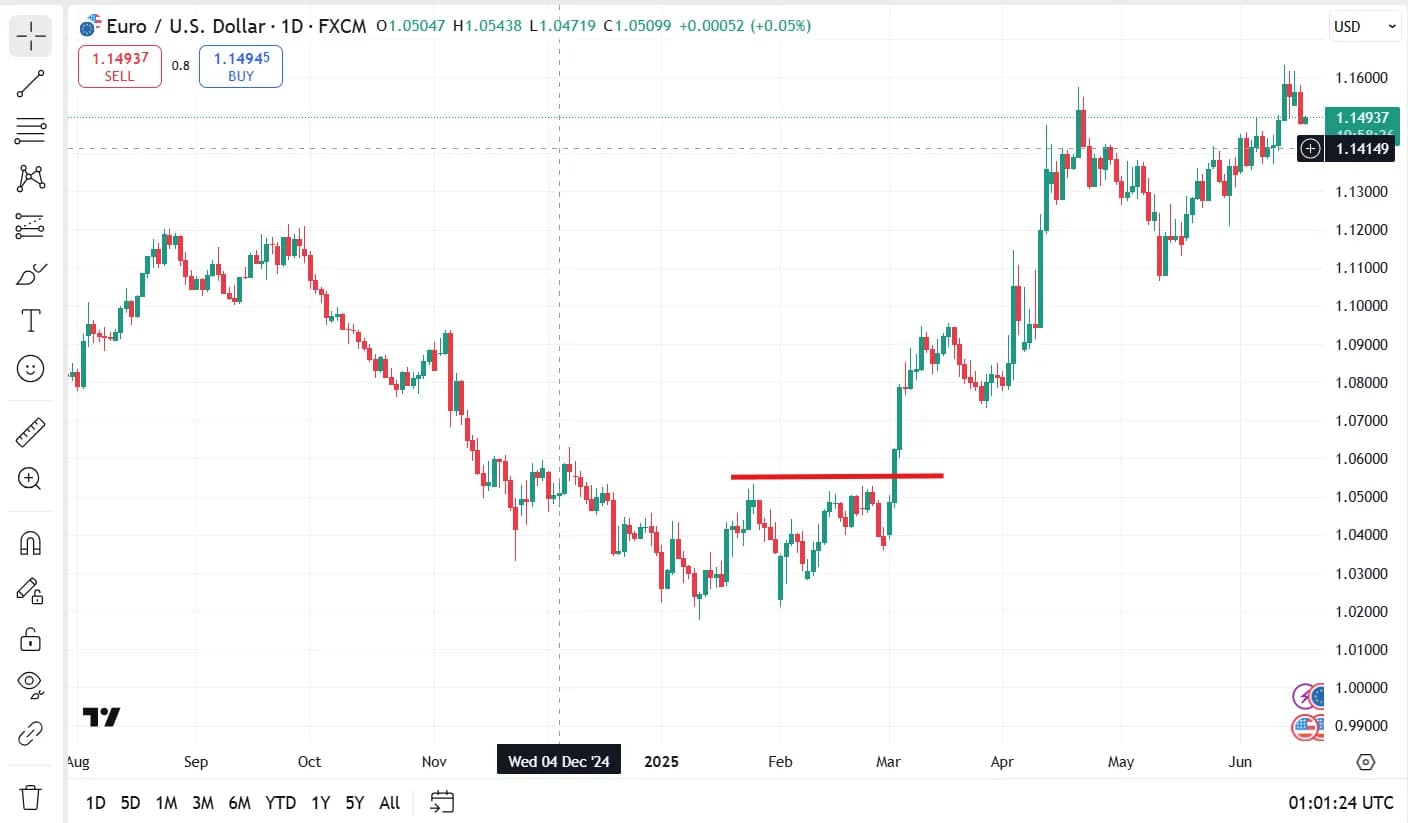
Now the only thing that's left is a technical entry. Here we can see consolidation and we can buy the breakout with a stop just below the 1 day breakout candle and we could have locked in multiple Rs depending on how you managed this trade.